Evaluation of Satisfaction of Pedestrian Safety to Vehicles in Urban Environment, Case Study: Old Context of Marvdasht City
Hasan Sotoude1 * , Keramatollah Ziari1 and Mehdi Gharakhlo1
1
Department of Urban Planning,
College of Art and Architecture, Hamedan Branch,
Islamic Azad University,
Hamedan,
Iran
2
University of Tehran,
Iran
http://dx.doi.org/10.12944/CWE.10.Special-Issue1.35
Nowadays paying attention to pedestrian movement as the healthiest way of transportation was always seriously attention by city managers. One of the factors influencing on walkability and also encouraging people for walking is to make a safe environment for walking. In this study with the purpose of studying pedestrian safety to vehicles issue in walkable environment at First we study the literature and extract the indices represent safety and after that by using a questionnaires, satisfaction percentage rate of each indices in citizens view calculated. Data analysis was done by factor analysis method in Lizrel software, results showed that the most important reason for pedestrian dissatisfaction of walkable environment safety is related to easy Crossing the street easily with 38 percent and after that the variable Presence of street crossing with 29 percent in second rank and Suitable car parking and maintain good vision with 12 percent in third rank and Presence of obstacle to traffic with 8. 7 percent in forth rank and after that the variable Observe speed limit by drivers with 7 percent in fifth rank and Safety in walkways to motorized vehicles with 5. 3 percent in sixth rank and the variable Separation of walking path and roadways has the least effect on safety.
Copy the following to cite this article:
Sotoude H, Ziari K, Gharakhlo M. Evaluation of Satisfaction of Pedestrian Safety to Vehicles in Urban Environment, Case Study: Old Context of Marvdasht City. Special Issue of Curr World Environ 2015;10(Special Issue May 2015). DOI:http://dx.doi.org/10.12944/CWE.10.Special-Issue1.35
Copy the following to cite this URL:
Sotoude H, Ziari K, Gharakhlo M. Evaluation of Satisfaction of Pedestrian Safety to Vehicles in Urban Environment, Case Study: Old Context of Marvdasht City. Special Issue of Curr World Environ 2015;10(Special Issue May 2015). Available from: http://www.cwejournal.org?p=732/
Download article (pdf)
Citation Manager
Publish History
Introduction
From the perspective of urban planning, designing modern cities are depended on car. However, this type of urban planning had reduced life quality by removing life’s mobility and good relationships between people in society and so that separation of peoples from public association caused reducing in social interactions, while walking on the sidewalks caused a lot of positive interactions between city peoples. On the other hand, the confusion and chaos in landscape and non-optimal use of landscape elements in city caused a gap in meeting the basic emotional needs of citizens. The active participation of the people in the city increases security in urban spaces that it is useful in continuity of life and its survival, which in the absence of it the quality of urban decrease and the meaning of city will goes out, in walkways, pedestrian should be always secure in front of vehicles and also the transportation should be strongly controlled (Mojtahed Sistani, 2008). In the literature there are some studies which pedestrian safety as one of the factors influencing choice of people for walking are assessed. Bhattacharyya and Mitrab (2013) in their research called Making Siliguri a walkable city used 5 factors for evaluating walkability, they believes that safety to vehicles is one of the factors influencing on walking and to have a walkable environment. ( Bhattacharyya and Mitrab (2013). Moeini in his research (walk safe life, access to transportation station) assessed factors related to safe and comfortable pedestrian access to transit stations, he believes that safety means to protect pedestrian against car accident in their route is one of the factors influencing pedestrian access to transit stations. (Moeini, 1391) Southworth said that safety to vehicles is a key factor in a walkable environment (Southworgh, 2005). In Walknomic Tool which measure street walkability by entering zip code it used factors such as Perception of safety and security, street cleanliness / gathering trash, the actual speed of traffic, the number of lights, sidewalks width, quality of street lights; sidewalks accessibility, Street crossing for pedestrians, respect to speed pumps and the number of street furniture and so on the walkability of that street measured. Some of indices that are used to assess safety to vehicles are:
Road safety: (To what extend you feel safety in this street ?)
Safe crossing: (How easily is crossing the street in places ?) because in influence traffic in streets, street width, hobble and pedestrian crossing. (www.walkonomics.com)
Research Methodology
The research process in a systematic and planned to find facts or understanding issues that seeks to find answers to the questions. (Hafez Nia, 2006). Yin said that when the main question of the research starts with why and how, and also when the research point at a contemporary phenomenon, we usually use case study for our research (Yin, 2000). So in this study we used case study method that this method is a kind of qualitative research.
In this study, first of all with studying literature we found that there are some factors influencing on pedestrian satisfaction of safety to vehicles that causes pedestrian to walk.
So for evaluation pedestrian satisfaction to safety we used 7 Variable to measure the pedestrian satisfaction to safety. Then to check the indicators in the study area we used questionnaire that its reliability has been checked by content analysis method which in this method the questionnaire was accessed by experts and the necessary correlation was done. Then we checked the validity of the questionnaire by use of Cronbach's alpha Test. Cronbach's alpha of the questionnaire was 0. 804 that it shows high reliability of it.
Determination of the minimum sample size necessary for gathering data relating to structural equation model is a very important. Although there is not an overall agreement in the case of the sample size required for the structural equation model and factor analysis, but in spite of many researchers minimum sample size are 200 samples. Kline believes in exploratory factor analysis we need 10 or 20 sample for each variables. But the minimum sample size is 200 samples (Hooman, 2011). So 200 questionnaire were fully loaded which is the results are shown below The case study in this research is the old context of Marvdasht city that because of the lack of planning and development it seems that walkability in this neighborhoods are low and people tend to walk less. In this study author uses factors influencing the safety of pedestrians to vehicles to explore the social and physical factors of the build environment that causes people to walk more or less.
Table1: Variables used for assessing pedestrian safety to vehicles
|
Goal |
Variable |
References |
|
Safety to vehicles |
Crossing the street easily |
Walkonomics |
|
Suitable car parking and maintain good vision |
Soltani and Pirozi 2013 |
|
|
Presence of street crossing |
Brennan Ramirez et al 2006 |
|
|
Presence of obstacle to traffic |
Brennan Ramirez et al 2006 |
|
|
Safety in walkways to motorized vehicles |
Cerin et al 1993, Southworth 2005, walk edmonton report, Bhattacharyya and mirab, shay et al 2003, Kumar 2009 |
|
|
Separation of walking path and roadways |
Soltani and Pirozi 2013 |
|
|
Observe speed limit by drivers |
Soltani and Pirozi 2013 |
Case Study
Region of Marvdasht have a very long History and had leaving behind great historical developments, but the city of Marvdasht has started developing by creating Sugar Factory in year 1933, The city has located in 48 kilometer in east of shiraz and near the Shiraz-Esfahan highway, From the Geographic location this city is located in the Center of Kor Rod plain between Cine aftabe Gondashlo Height at the west and Rahmat mountain at the east. The city Geographic coordinate is in 55 degree and 29 minute width Northern and 53 degree and 52 minute length within Eastern and its Height from sea level is about 1600 m from the sea. Based on official statistics in 1390, the population of the city is 138649 people that 70221 people were male and 68428 people were female. The number of family in this year was 37918 Family. City of Marvdasht Has passed away 80 spring from the First physical appearance by Created sugar factory, thus if we can name a place historical in definition that have more than 100 year, so the marvdasht city have not a historical context, but we can find the old context of city in the central area of the city that have more than 70 years. The oldest context of the city are in this place that Sugar factory is in its center and Municipality building are near it. So Marvdasht has expanded along the main streets over times and urban centers with different uses made. These centers became weaker as far as they are farthest from the city center. Old context of Marvdasht city include 4 zones of 10 neighborhoods that its area is about 175529 m2 (net area of old blocks) and 2340524 m2 (old context impure). The population of old context is 42475 people and the population of neighborhoods is 81631 (Khod Avand, 2009). In this study the author calls the old context as the old name because despite the renovation and improvement of some parts there are a lot of problems in this context, especially in terms of city infrastructure.
 |
Figure1: Marvdasht Map in Iran |
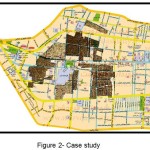 |
Figure2: Case study Click here to View figure |
Research Finding
To check the pedestrian satisfaction from safety to vehicles in the study area, 7 variable that are taken from literature are used. that are shown in Table 2.
Table2: Variable indicate Safety Factor
|
Variable |
Factor |
|
Crossing the street easily |
Safety |
|
Suitable car parking and maintain good vision |
|
|
Presence of street crossing |
|
|
Presence of obstacle to traffic |
|
|
Safety in walkways to motorized vehicles |
|
|
Separation of walking path and roadways |
|
|
Observe speed limit by drivers |
Table3: Descriptive analysis of answers to safety Factor
|
Very little |
Little |
Normal |
High |
Very High |
Variable |
Factor |
|
9.5 |
15 |
44.5 |
16.5 |
14.5 |
Crossing the street easily |
safety |
|
27 |
41 |
24.5 |
4.5 |
3 |
Suitable car parking and maintain good vision |
|
|
14.5 |
26.5 |
49.5 |
8.5 |
1 |
Presence of street crossing |
|
|
3 |
8 |
33.5 |
35 |
2.5 |
Presence of obstacle to traffic |
|
|
41.5 |
28.5 |
20 |
8 |
2 |
Safety in walkways to motorized vehicles |
|
|
3.5 |
5.5 |
18.5 |
27.5 |
45 |
Separation of walking path and roadways |
|
|
25 |
31 |
40 |
2.5 |
1.5 |
Observe speed limit by drivers |
then by using Factor Analysis Method in lisrel software, Factor loading on each variable calculated and goodness of fit indices of model were checked that results are shown as follow:
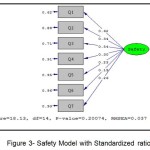 |
Figure3: Safety Model with Standardized ratio |
T-Value were used to check the path meaningful between latent variable and observed variable
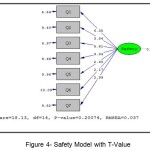 |
Figure4: Safety Model with T-Value Click here to View figure |
Results
The method for parameter estimation is maximum likelihood method which Path coefficient between the variable crossing the street easily and our latent variable (Safety) is equal to 0.71 and its error is equal to 0.82. T-Value in order is 6.35 and 5.56, and it is meaningful at the level of less than 0.001. Also about 38% of the variance of latent variable (Safety) is defined by the Crossing the street easily variable. Path coefficient between the variable Suitable car parking and maintain good vision and our latent variable (Safety) is equal to 0.33 and its error is equal to 0.86. T-Value in order is 3.84 and 9.4, and it is meaningful at the level of less than 0.001. Also about 12% of the variance of latent variable (Safety) is defined by the Suitable car parking and maintain good vision variable. Path coefficient between the variable Presence of street crossing and our latent variable (Safety) is equal to 0. 48 and its error is equal to 0.56. T-Value in order is 5.81 and 6.97, and it is meaningful at the level of less than 0. 001. Also about 29% of the variance of latent variable (Safety) is defined by the Presence of street crossing variable. Path coefficient between the variable Presence of obstacle to traffic and our latent variable (Safety) is equal to 0.30 and its error is equal to 0.93. T-Value in order is 3.34 and 9.66, and it is meaningful at the level of less than 0. 001. Also about 8. 7% of the variance of latent variable (Safety) is defined by the Presence of obstacle to traffic variable. Path coefficient between the variable Safety in walkways to motorized vehicles and our latent variable (Safety) is equal to 0.24 and its error is equal to 1.03. T-Value in order is 2.6 and 9.96, and it is meaningful at the level of less than 0. 001. Also about 5.3% of the variance of latent variable (Safety) is defined by the Safety in walkways to motorized vehicles variable. Path coefficient between the variable Separation of walking path and roadways and our latent variable (Safety) is equal to 0.31 and its error is equal to 1.2. T-Value in order is 2.17 and 10.09, and it is meaningful at the level of less than 0.001. Also about 3. 7% of the variance of latent variable (Safety) is defined by the Separation of walking path and roadways variable. Path coefficient between the variable Observe speed limit by drivers and our latent variable (Safety) is equal to 0.24 and its error is equal to 0.78. T-Value in order is 2.99 and 9.82, and it is meaningful at the level of less than 0. 001. Also about 7% of the variance of latent variable (Safety) is defined by the Observe speed limit by drivers variable.
Table4: Path coefficient and its error with T-Value and Variance of safety model
|
Safety |
Question |
|||||
|
R2 |
T-value |
Error |
T-Value |
Path coefficient |
Variable |
|
|
0.38 |
5.56 |
0.82 |
6.35 |
0.71 |
Crossing the street easily |
Q1 |
|
0.12 |
9.4 |
0.86 |
3.84 |
0.33 |
Suitable car parking and maintain good vision |
Q2 |
|
0.29 |
6.97 |
0.56 |
5.81 |
0.48 |
Presence of street crossing |
Q3 |
|
0.087 |
9.66 |
0.93 |
3.34 |
0.30 |
Presence of obstacle to traffic |
Q4 |
|
0.053 |
9.96 |
1.03 |
2.6 |
0.24 |
Safety in walkways to motorized vehicles |
Q5 |
|
0.037 |
10.09 |
1.2 |
2.17 |
0.31 |
Separation of walking path and roadways |
Q6 |
|
0.070 |
9.82 |
0.78 |
2.99 |
0.24 |
Observe speed limit by drivers |
Q7 |
Goodness of Fit Indices
To what extent our model that has been based on a theoretical frame and literature is compliance with the facts is a question that we want to find the answer with the help of Goodness of fit. In other word, the scientific criteria for accepting model by using our collected data, is the main discussion in goodness of fit indices.
Those indices name goodness of fit because if it increases it show that our data support our model better and name badness of fit indices because the more it increases it means that the data support our model less. Hooman, 2012)
Table5: Recommended indices by some Researchers
|
Researcher |
Recommended indices |
|||||||
|
X2 |
RMSEA |
CFI |
NFI |
NNFI |
PNFI |
SRMR |
R2 |
|
|
McDonald,R. P. & Ho, R. M. 2002 |
* |
* |
* |
* |
||||
|
Hu, L. T & bentler, P. M. 1999 |
* |
* |
* |
* |
||||
|
Kline, R. B. 2005 |
* |
* |
* |
* |
* |
|||
|
Boomsma,A. 2000 |
* |
* |
* |
* |
* |
|||
|
Hooper et al,2008 |
* |
* |
* |
* |
* |
|||
Homan (2012) said that the acceptable values for mentioned indices are shown in table 6. (Hooman, 2012) So the author uses his indices for testing model fitness.
Analysis Goodness of Fit for Safety Model
First indices to be check is chi-square, as far as chi square Test result is smaller it show the model fit better.
Here the chi square with 14 degree of freedom is about 18.13 that is not meaningful because the meaningful level of it is large and equal to 0.3 ( its larger than 0.05). So it means that chi square Test shows the exact model fit with the data.
In other hand the ratio of chi square to degree of freedom is equal to 1.295. Furthermore the RMSEA is equal to 0.037 and in 90 percent confidence level it is between 0.000 and 0.008 and because the low level of it is below 0.05 so we conclude that the degree of model approximation in community is not large. The RMR is equal to 0.049 that is very small and shows the minimum error of model and it means that the model fit is acceptable.
Table6: Goodness of fit for security model
|
indices |
Acceptable Range |
Calculated |
|
Chi square (X2) |
Smaller is better |
18.13 |
|
Chi square / degree of freedom |
Less than 2.0 |
1.295 |
|
Root Mean Square Error of Approximation (RMSEA) |
Less than 0.05 |
0.037 |
|
Root mean residual (RMR) |
Less than 0.07 |
0.049 |
|
CFI |
More than 0.9 |
0.94 |
Discussion and Conclusion
Walking is a means of experiencing and interacting with the local environment and wider society in a way not possible when using other forms of transport, particularly motor transport. There is a strong emphasis on walking as both an indicator of and a means of improving the public realm as part of the improvement in local environment and urban renaissance. When we are walking, not also our physical parts of our body work, but our mental system is working, so providing a condition which pedestrians can walk safety and easily and also enjoy of walking in the urban environment is very important, in this study with the purpose of studying pedestrian safety to vehicles in walkable environment first we study the literature and extract the indices represent safety and after that by using a questionnaires, percentage rate of satisfaction of each indices in citizens view calculated.
For analysing the gathered data of quastionnairs we used factors analysis method in lisrel software. results show that the most important reason for pedestrian dissatisfaction of walkable environment safety is related to easy Crossing the street easily with 38 percent and after that the variable Presence of street crossing with 29 percent in second rank and Suitable car parking and maintain good vision with 12 percent in third rank and Presence of obstacle to traffic with 8. 7 percent in forth rank and after that the variable Observe speed limit by drivers with 7 percent in fifth rank and Safety in walkways to motorized vehicles with 5. 3 percent in sixth rank and the variable Sepration of walking path and roadways has the least effect on safety.
thus as far as in urban planning our final goal is to improve life condition, so in our research the final purpose will end to improve safety on pedestrian in urban environment. according to the author’s result the most important reason of pedestrian dissatisfaction of safety to vehicles is related to “crossing the street “ issue which in old context of marvdasht city it is very hard to cross the street easily because there is not enough street crossing in roads and also in two sided streets there is no refioue in streets, another important point is that in old context of marvdasht city there is no park slots and drivers park their vehicles in one side of the street and it will caused o decrease good vision for pedesrtian while crossing streets. according to author results some sujjections are listed below to improve pedestrian safety in old context of marvdasht city:
Create street crossing to increase pedestrian safety while crossing the street
Monitoring on car parking in the right places to encourage drivers to use public parking lots instead of Street Park.
Create obstacles beetween walkways and roads to increase pedesrian safety to traffic Prevent from entering bikes and bycycles in walkways.
References
- American urban planning society, places and place-making, planning and urban design standards, translated by Etemad. G, behzadfar. M, Salehi Milani. S, Iranian society of consulting engineers publication (2008)
- Brennan Ramirez LK, Hoehner CM, Brownson RC, Cook R, Orleans CT, Hollander M, Barker DC, Bors P, Ewing R, Killingsworth R, Petersmarck K, Schmid T, Wilkinson W.. "Indicators of Activity-Friendly Communities: An Evidence-Based Consensus Process". American Journal of Preventive Medicine. 515–524. (2006)
- Bhattacharyyaa,D. Mitrab, S., Making Siliguri a walkable city, 13th COTA International Conference of Transportation Professionals, Procedia - Social and Behavioral Sciences no 96, 2737 – 2744 (2013)
- Boomsma,A. Reporting analysis of covariance structure, structural equation modeling, 7, 461-483 (2000)
- Cerin, E., Saelens, B. E., Sallis, J. F., & Frank, L. D. Neighborhood Environment Walkability Scale: Validity and Development of a Short Form. Medicine and Science in Sports and Exercise, 38(9), 1682-1691 (2006)
- Ghassemi,V. structural equation modeling in social research using Amos graphics, sociologists publication (2013)
- Hafeznia, m.,an introduction to research methods in the humanities, Samt publication (2006)
- Hu, L. T & bentler, P. M., Cutoff criteria for fit indexes in covariance structure analysis: conventional Criteria versus new alternatives. Structural equation modeling, 6, 1-55 (1999)
- Hooper, D., Coughlan, J. & Mullen,M. R. Structural equation modeling: guildelines for determining model fit. the electronic journal of business Research Methods, 6, 53-60 (2008)
- Hooman, h,. structural equation modeling using Lisrel software, organization of study and compilation books of the Humanities (2012)
- Kline, R. B. principles and practice of structural equation modeling second edition, the Guilford press, New York. (2005)
- Kumar, R.,Walkability of Neighborhoods: A Critical Analysis of Zoning Codes, M. A thesis submitted to the Division of Research and Advanced Studies of the University of Cincinnati. (2009)
- Khod Avand, consulting engineers, improvement and renovation of old context of marvdasht city plan, abstract report, (2009),
- McDonald,R. P. & Ho, R. M. Principles and practice in reporting structural equation analyses, psychological methods,7,64-82 (2002)
- Moeini. S, walk safe life (access to transportation station), landscape magazine, 15, 62-65 (2011)
- Sistani mojtahed, A.,Quality compliance walkways and urban streets factors, International Conference on civil engineering students, Semnan, Iran. (2008)
- Soltani, A. Piroozi R.,Surveing Historical route walkability, case study:Hafez route (Shiraz), journal of city and architecture, 3, 65-77 (2013)
- Shay, Elizabeth. Spoon, Steven C and Khattak, Asad J. “Walkable Environments and Walking Activity”. Final Report for Seed Grant Submitted to: Southeastern Transportation Center University of Tennessee Knoxville, Tennessee (2003)
- Southworth, M., “Designing the Walkable City”. Journal of Urban Planning and Development.. (2005)
- www. walkonomics. com
- Walk edmonton report
- Yin, R. K.. Case Study Research (Design and Methods): Sage Publications (2003)


